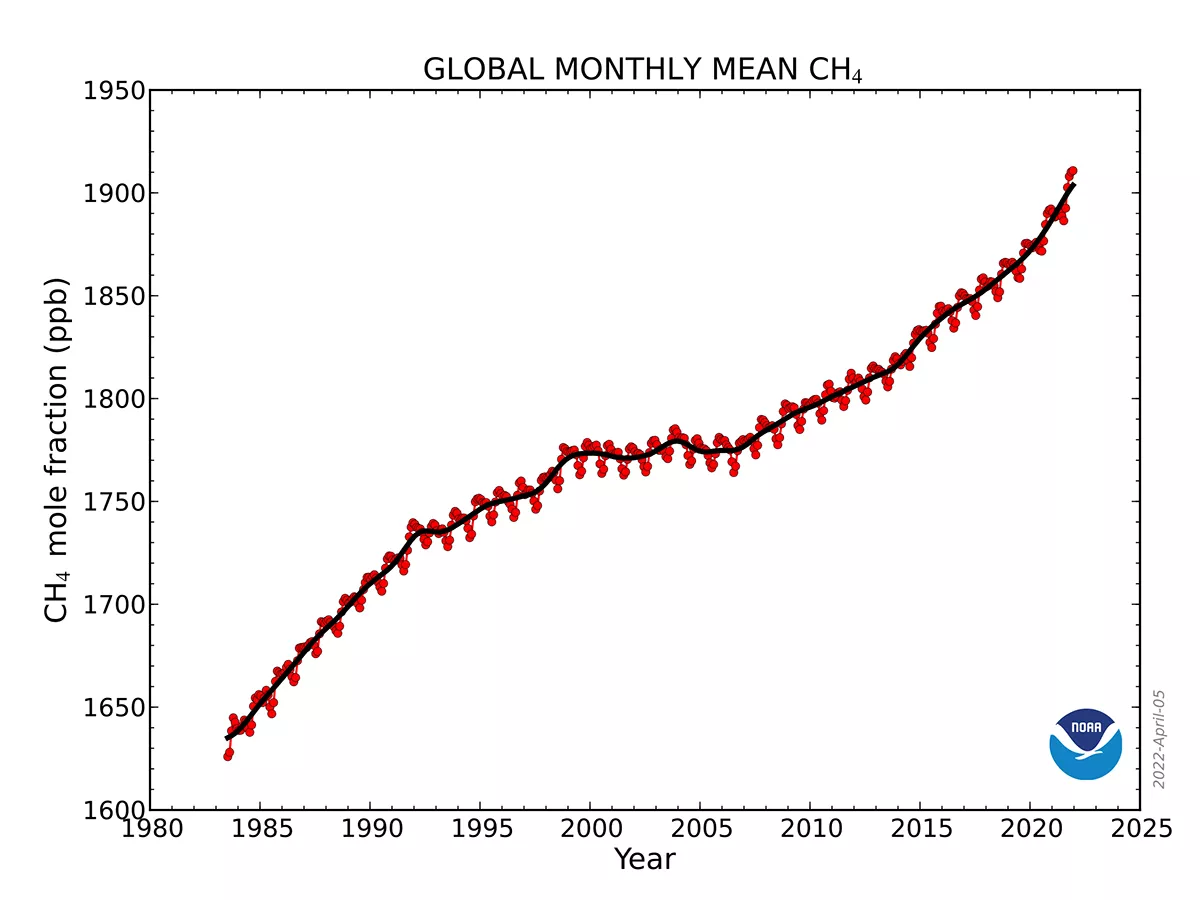
The last few years have seen atmospheric methane (CH4) surge to an average of nearly 1,900 parts per billion (ppb), more than two and a half times pre-industrial levels. The largest increase on record occurred in 2021, beating the previous record set just one year prior. These unprecedented numbers are worrisome. “After carbon dioxide, methane is the second most important greenhouse gas contributing to human-induced climate change,” says Dr. Youmi Oh, a research scientist at NOAA’s Global Monitoring Laboratory. “And unlike the steady increase of carbon dioxide and nitrous oxide, atmospheric methane shows a unique long-term trend.”
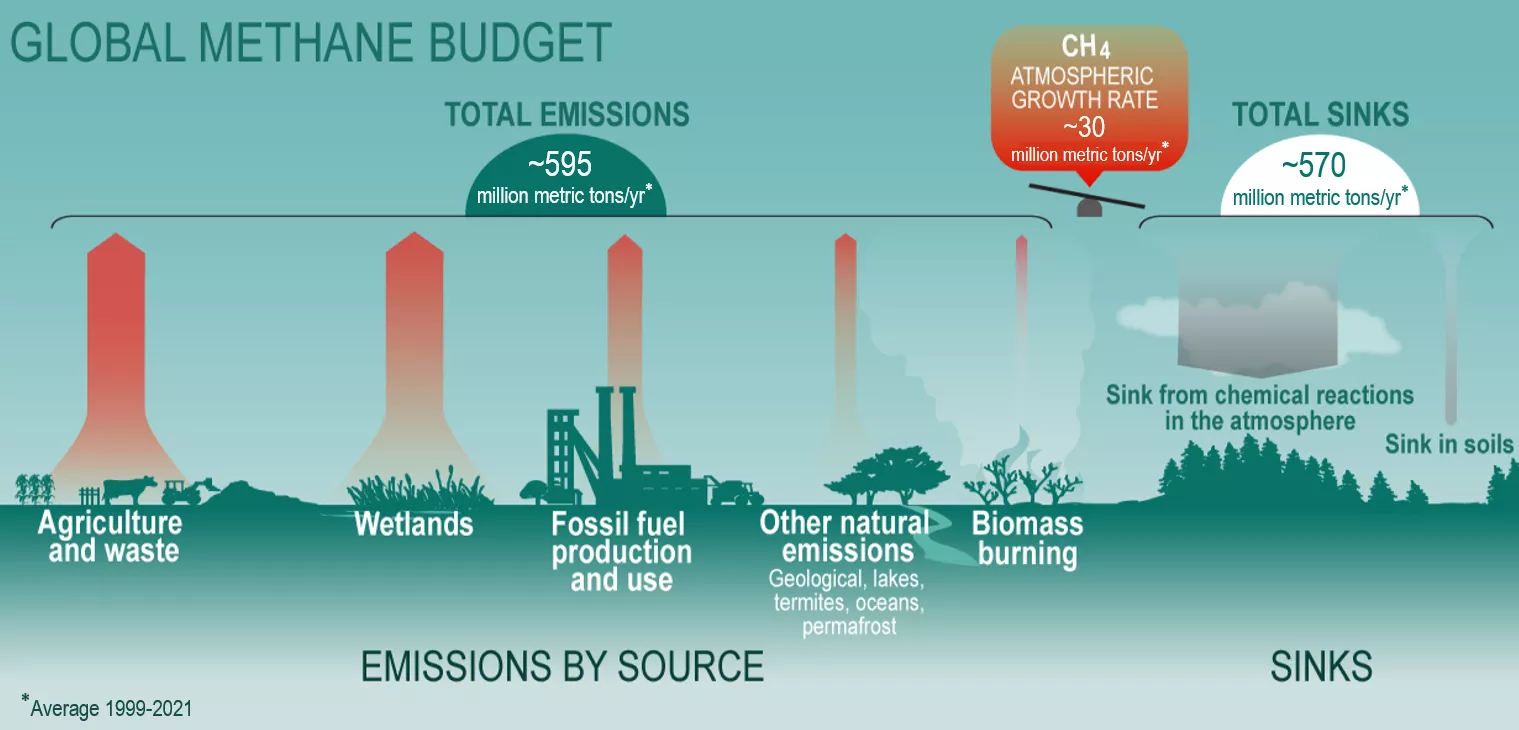
Methane’s effectiveness at absorbing energy is at the root of the problem—it is around 28 times more efficient than carbon dioxide at trapping heat in the atmosphere, heat that contributes to a warming planet. Trace amounts of methane in the atmosphere are normal, the result of natural environmental processes that occur in wetlands, for example. But the soaring concentrations of atmospheric methane seen today are mostly from anthropogenic activity like agriculture, oil and gas production, coal extraction, and waste facilities.
There is hope: “The fact that methane is chemically reactive makes it possible to have a disproportionately large effect on temperature change, but it also presents an opportunity because reducing methane emissions can have a relatively quick climate benefit because of its short lifetime,” says Dr. Oh. “The lifetime of methane is 9 to 10 years, which is much shorter than the lifetime of carbon dioxide [between 300 to 1,000 years], meaning if we reduce methane emission right now, we could see the changes in atmospheric methane in ten years.”
Scientists need a clear understanding of methane sources and sinks to develop targeted solutions for emission reduction, but which particular sector is driving the recent rapid growth in methane concentration is widely debated. To help provide answers, scientists at the NOAA Global Monitoring Laboratory have developed a combined methane measurements and modeling system called CarbonTracker-CH4 that estimates global methane emissions by source and assesses the effect of methane removal from the atmosphere. In addition to providing valuable information for research, scientists are also using CarbonTracker-CH4 to evaluate the influence of atmospheric chemistry on the sensitivity of methane measurements from the JPSS Cross-track Infrared Sounder (CrIS).
An overview of recent trends in atmospheric methane concentration, applications of CarbonTracker-CH4, and the road ahead will be featured in the 2023 JPSS Annual Science Digest, published online each year in January. Learn more about the Digest and read previous issues at www.nesdis.noaa.gov/jpss-digest.